
Black holes and algorithms. How computer science helped us see a black hole for the first time


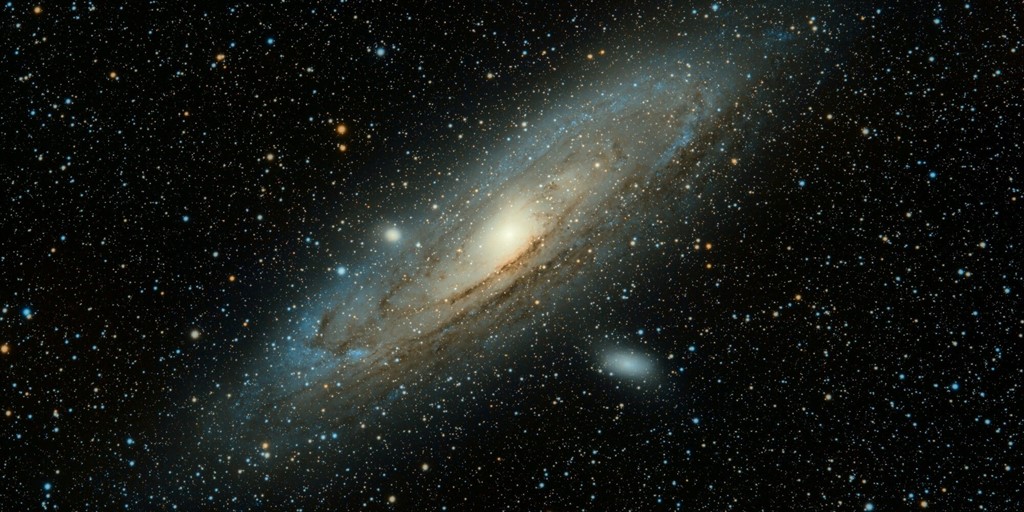
It was Wednesday, 10 April 2019, when scientists spread the news of imaging black hole from Messier 87 galaxy (M87 for short). M87 is located in the constellation Virgo 55, million light years from Earth. That black hole weighs 6 billion times as much as the Sun!
Its image was not created like an ordinary image. In some articles, you may find misleading headlines saying it's a photo of a black hole. If you think that people zoomed in an image from one of the telescopes, then you couldn't be further from the truth. To create this image large amount of observation data was collected from several telescopes performing parallel observations. Next, all the data were combined and used to reconstruct the image that we saw in the news. In this post, I will describe this process, showing the role of image processing algorithms in this experiment.
This post was written based on the article "First M87 Event Horizon Telescope Results. IV. Imaging the Central Supermassive Black Hole". We only scratched the surface here, so if you want to go into depth you should read this paper (see sources at the end).
What is a black hole?
To fully appreciate this result we should remind ourselves what a black hole is exactly. A black hole is a region of space within which gravity pulls so much that nothing, not even light, can escape. This implies that black cannot be seen directly, though we can see gravity effects near the black hole. Strong gravity is a result of squeezing huge mass into a tiny space. To become a black hole, a star has to be massive (at least 20 times heavier than the Sun). There is a formula for calculating the radius of the created black hole. If hypothetically the Sun became a black hole, its radius would be reduced to 3 km.
In 1916, Einstein completed his work where he described the general relativity theory. He characterized gravity using geometric concepts - geometric theory of gravitation. Einstein proposed that spacetime is curved around heavy objects. One of the consequences of Einstein's theory is that the time isn't the same in every place of the universe. One of the real-world application is the calculation of coordinates by navigation devices that communicate with GPS satellites. Amendment resulting from general relativity theory is crucial to obtain a precise result for coordinates calculations. If you want to explore black hole concepts further, I recommend you to watch this video - it's originally in Polish, but you can turn on English subtitles:
Observation description
To observe such distant object scientists came up with the idea of combining data from several telescopes distributed around the Earth. This array of telescopes is called the Event Horizon Telescope (EHT). Here is a list of all facilities that collaborated in the black hole observations:
- the phased Atacama Large Millimeter/submillimeter Array (ALMA),
- Atacama Pathfinder Experiment telescope (APEX) in the Atacama Desert in Chile,
- the James Clerk Maxwell Telescope (JCMT),
- the phased Submillimeter Array (SMA) on Maunakea in Hawai'i,
- the Arizona Radio Observatory Sub-Millimeter Telescope (SMT) on Mt. Graham in Arizona,
- the IRAM 30 m (PV) telescope on Pico Veleta in Spain,
- the Large Millimeter Telescope Alfonso Serrano (LMT) on Sierra Negra in Mexico,
- the South Pole Telescope (SPT).
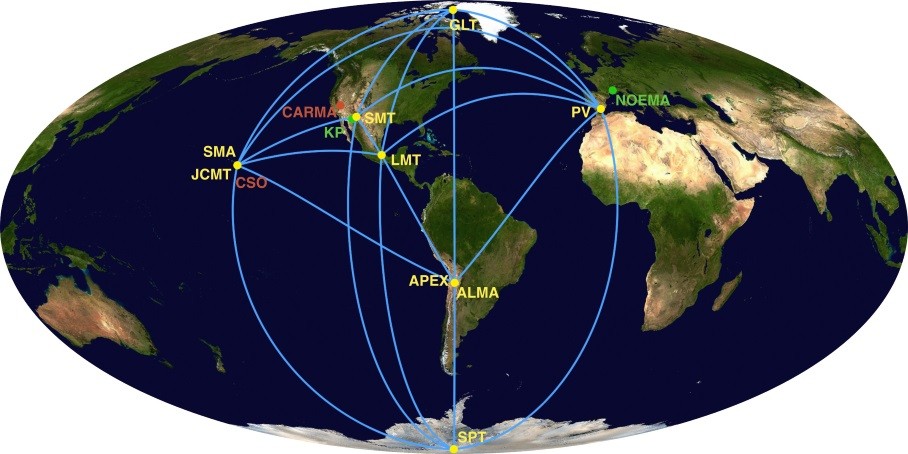
The biggest advantage of this virtual telescope is that its diameter is equal to the longest distance between the telescopes in array, i.e. distance between Spain and the South Pole. The biggest challenge is different weather conditions around the globe that could prevent you from gathering data from all places. EHT team decided that the best dates for observation were April 5, 6, 10, and 11 in 2017. On these days different target observations interleaved with black hole observation and results were later used for comparison. The number of scans on individual days is 18, 25, 7 and 22. A single scan is an observation between 4 and 7 minutes. Here is a picture in which you can see coverage for EHT observations of M87.
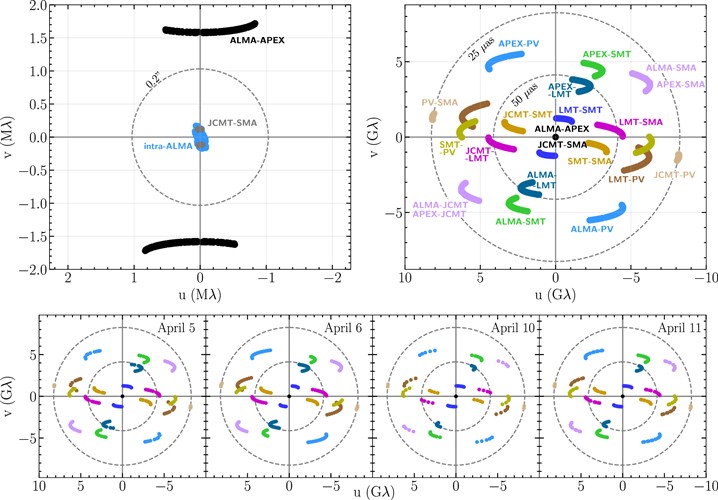
If the EHT team put telescopes all around the Earth, they would record data for every point, and then it would be relatively easy to make an image using known image processing algorithms, e.g. Fourier transformation. But since they only have telescopes at several places they only get a scarce number of measurements. Earth rotation helped us to expand observation coverage. Team working at each facility recorded petabytes of data. At some point, all this data had to be transported to one location. Sending it over the Internet network would take longer than moving it physically. Then the data analysis could begin.
How computer science was applied to generate the image?
Due to a limited set of samples in the visibility domain, we cannot reconstruct the image accurately. The team had to enforce constraints that were not implied by the measurements. That's how you may see different images that were reconstructed at different steps.
In the first step, the team worked on correlating data from observation and replacing a weak signal by a stronger one hidden in that correlated data. This reduced data size from petabytes to terabytes. Observed data can be expressed by convolution formula f = g * h. In other words, we know that observed image f is equal to actual image g convoluted with factors that deformed observed image h, i.e. f = g * h, where f, g, h are functions and * stands for convolution. Factors that deformed black hole observed data are mainly caused by the atmosphere (different weather conditions among observatories) and calibration errors. We know f, more or less h and we have to solve this equation for g.
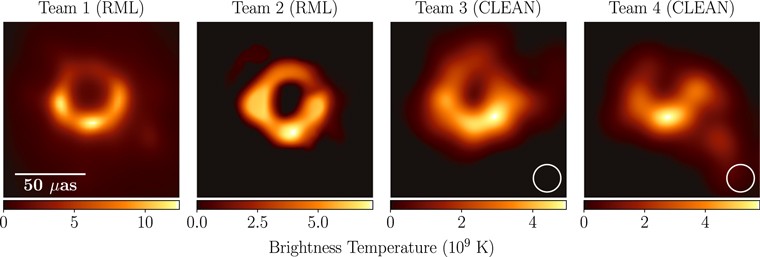
In the second step, four teams were formed and they worked independently using different algorithms to produce the black hole image. Imaging algorithms can be generally divided into two categories: forward modeling and inverse modeling. In forward modeling, you take the current state of some object and you run your algorithm to see how your object changes in the future. Inverse modeling is the opposite of forward modeling, i.e. your model is in some state and you want to calculate what state can produce the initial state. The team used algorithms based on CLEAN for inverse modeling and RML - regularized maximum likelihood for forward modeling. Both are image reconstruction techniques that reverse the result effects of convolution on observed data. To learn more about these algorithms you can see this website. Here is a comparison of the images reconstructed by each team:
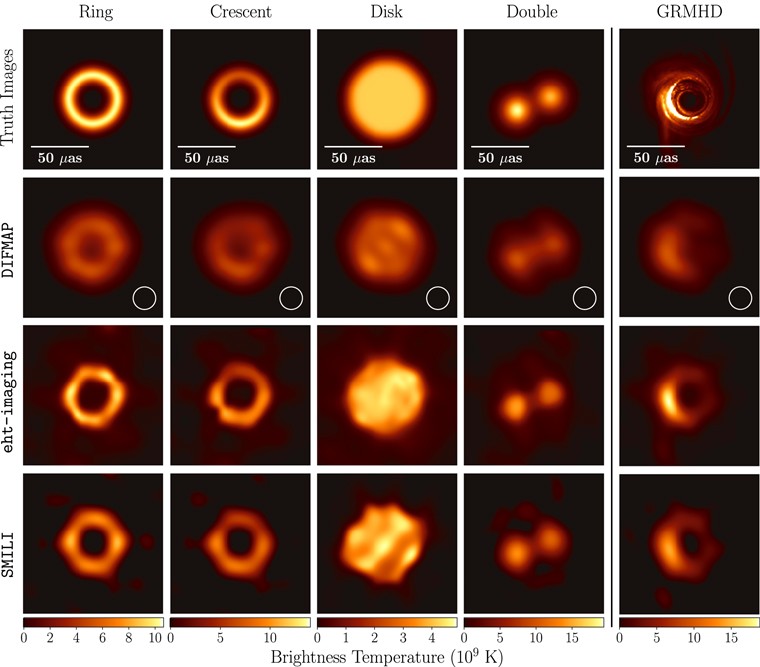
In the third step, the team worked on choosing imaging parameters that produce in some sense the best picture. Among other things they tested different parameter values for synthetic images and restored images using those parameters. They selected geometric models that are similar to those observed in M87, e.g. ring, crescent, disk. See the image below for comparison of different algorithms that were run with the best-selected parameters. The last step was the final image validation. The team performed additional tests to assess the reliability of the created image.
Summary
This procedure took almost two years to complete it. The final image is a result of a joint effort of more than 200 researchers!
If you want to see the black hole image in original size 7416 x 4320 px, follow this link. In the future, we can expect more detailed images as more telescopes are added to EHT array. Perhaps space telescopes could be used to enhance this image and maybe record video. The future is going to be exciting!
Sources:
1. The Event Horizon Telescope Collaboration et al 2019 ApJL 875 L4
2. Katie Bouman - Imaging a Black Hole with the Event Horizon Telescope
About the Author
Marcin Zarębski is an experienced back-end developer, specializing in. .NET platform. He never ceases to amaze us with his skills in building complex backend solutions and infrastructure. Marcin is also interested in space exploration and the role of computer science in it. He likes to spend his free time in the mountains or playing board games.
 Angry Nerds (Poland)
 Angry Nerds (USA)
 Angry Nerds (Canada)


